Altmetric Analysis of CSIC Publications

Click the full-screen icon in the bottom-right corner to expand the dashboard.
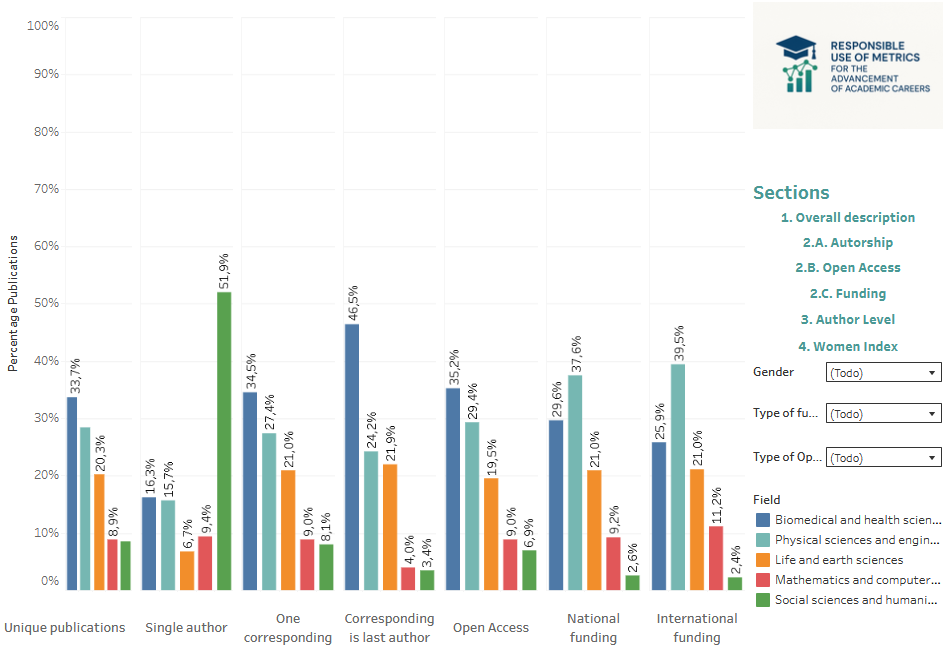
Compartir

Related Posts

Altmetric Analysis of CSIC Publications

¿Qué es este dashboard y para qué sirve?

Este dashboard muestra cómo las publicaciones del Consejo Superior de Investigaciones Científicas (CSIC) generan atención y visibilidad social y mediática en entornos online. La herramienta permite explorar la interacción entre ciencia y sociedad, observando cómo distintos tipos de publicaciones, institutos y áreas temáticas dentro del CSIC reciben atención en medios y plataformas digitales.

El análisis integra datos de Altmetric, plataforma que recopila y analiza la atención que reciben las publicaciones científicas en medios de comunicación, redes sociales y otras fuentes online, y de GesBIB, la base de datos institucional del CSIC que consolida información normalizada sobre su producción científica y sus principales indicadores

El dashboard permite realizar análisis diversos y exploratorios, adaptables a distintas necesidades de investigación, gestión o policy, entre ellos:
  • Evaluación de la atención altmétrica mediante indicadores como el Altmetric Attention Score (AAS) y otras métricas de presencia online.
  • Análisis de cobertura, intensidad y densidad de atención según:
    • tipología documental (artículos, libros y capítulos de libro),
    • áreas temáticas e institutos, para observar diferencias disciplinares,
    • modelo de acceso, género y posición de autoría, lo que permite explorar posibles desigualdades en la visibilidad social de la investigación.
  • Comparaciones con medidas de impacto académico, como el Field Citation Ratio (FCR), cuando se utilice como estudio de caso dentro de la plataforma.
  • Análisis de tendencias temporales y patrones de interacción entre ciencia y sociedad.
El dashboard no está limitado a análisis predefinidos y puede utilizarse para generar nuevas consultas y estudios específicos, según los objetivos analíticos planteados.

Este dashboard es útil para:

  • Investigadores, que pueden comprender cómo su producción científica y su área temática interactúan con distintos públicos y espacios de atención social y mediática.
  • Gestores y responsables institucionales, como apoyo a estrategias de comunicación científica, análisis de la interacción ciencia–sociedad y evaluación basada en evidencia agregada.
  • Responsables de evaluación y policy, como herramienta complementaria para el análisis estratégico del impacto y la visibilidad de la investigación.

Este dashboard no está concebido para evaluar el rendimiento individual ni para elaborar rankings. Los indicadores deben interpretarse de forma:

  • Agregada y comparativa, para identificar patrones y tendencias generales.
  • Contextualizada por áreas temáticas, teniendo en cuenta que las diferencias observadas reflejan culturas disciplinares distintas de publicación, comunicación e interacción con audiencias.
  • Complementaria, utilizando los altmetrics para analizar atención y circulación social de la investigación, y otras variables (como el FCR) únicamente cuando se empleen como casos de estudio específicos.

Este dashboard se enmarca en los resultados del proyecto RESPONSIBLE y está alineado con los principios de CoARA y el enfoque de métricas responsables. Promueve un uso contextualizado y prudente de múltiples indicadores, reconociendo la diversidad disciplinar y las distintas formas de producción, comunicación y visibilidad científica. La herramienta está orientada a ofrecer evidencia empírica para comprender las dinámicas del sistema científico y apoyar la toma de decisiones institucionales, evitando usos simplificadores o punitivos de los indicadores.

What is this dashboard and what is it for?

This dashboard shows how publications from the Spanish National Research Council (CSIC) generate social and media attention and visibility in online environments. The tool allows users to explore the interaction between science and society by observing how different types of publications, institutes, and thematic areas within CSIC receive attention across media and digital platforms.

The analysis integrates data from Altmetric, a platform that collects and analyzes the attention received by scientific publications in news media, social networks, and other online sources, and from GesBIB, CSIC’s institutional database that consolidates standardized information on its scientific output and main indicators.

The dashboard enables a wide range of exploratory analyses, adaptable to different research, management, or policy needs, including:

  • Evaluation of altmetric attention using indicators such as the Altmetric Attention Score (AAS) and other online presence metrics.
  • Analysis of coverage, intensity, and density of attention by:
    • document type (articles, books, and book chapters),
    • thematic areas and institutes, to observe disciplinary differences,
    • access model, gender, and authorship position, allowing exploration of potential inequalities in the social visibility of research.
  • Comparisons with measures of academic impact, such as the Field Citation Ratio (FCR), when used as a case study within the platform.
  • Analysis of temporal trends and patterns of interaction between science and society.
The dashboard is not limited to predefined analyses and can be used to generate new queries and specific studies, depending on the analytical objectives pursued.

This dashboard is useful for:

  • Researchers, who can better understand how their scientific output and thematic area interact with different publics and spaces of social and media attention.
  • Managers and institutional leaders, as support for science communication strategies, analysis of science–society interactions, and evidence-based evaluation at an aggregated level.
  • Evaluation and policy officers, as a complementary tool for the strategic analysis of research impact and visibility.

This dashboard is not designed to evaluate individual performance or to produce rankings. Indicators should be interpreted in a:

  • Aggregated and comparative way, to identify general patterns and trends.
  • Contextualized by thematic areas, bearing in mind that observed differences reflect distinct disciplinary cultures of publication, communication, and audience interaction.
  • Complementary manner, using altmetrics to analyze attention and social circulation of research, and other variables (such as the FCR) only when employed as specific case studies.

This dashboard is part of the outcomes of the RESPONSIBLE project and is aligned with the principles of CoARA and the responsible metrics approach. It promotes a contextualized and prudent use of multiple indicators, recognizing disciplinary diversity and different forms of scientific production, communication, and visibility. The tool is intended to provide empirical evidence to understand the dynamics of the scientific system and to support institutional decision-making, avoiding simplistic or punitive uses of indicators.